Mapping Human Impacts
All of the natural resources you have been investigating at your sites – landforms and their soils, water quality and quantity in the form of snow, birds, plants, and macroinvertebrates – can be studied using mapping, as we discussed in Module 1: Mapping. Let’s see how maps can be a tool for presenting and analyzing data.
Soils
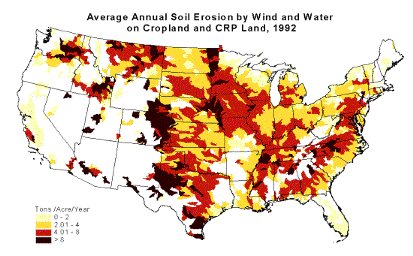
Figure 9.19: Erosion results in tons of topsoil loss from croplands in Montana and around the US every year. A number of state and federal agencies collect data on soil erosion processes and rates. This helps prioritize management of high erosion risk areas and develop strategies for slowing or reversing erosion.
Image from URL: http://www.epa.gov/agriculture/ag101/cropsoil.html
Water Quality

Figure 9.20: Every day the United States Geological Service (USGS) collects real-time water quality data at sampling stations around the country. This national map shows data on specific conductance (uS/cm) at these stations on November 8, 2010. The map can be changed to show different parameters such as temperature, conductance, pH, dissolved oxygen, turbidity and discharge. The map can be also be animated to show how these parameters have changed over the last month or year.
Image from URL: http://waterwatch.usgs.gov/wqwatch/
You can zoom in on different states and even look at data from individual stations. Check it out here. The USGS recently released a report on samples scientists took from over 500 public well-water supplies in 41 states (Montana unfortunately was not one of those sampled). The results indicate human impacts on the sources of contamination in public water supplies. Human sourced contaminants included Dieldren (insecticide), nitrate (naturally occurring but elevated levels suggest agricultural fertilizer, manufacturing and fossil fuel burning), and perchloroethene (solvent used in dry cleaning, textile industries, metal cleaning and rubber coating). In addition, some potentially harmful organic compounds were very common in well samples, but are not represented because human-health benchmarks for these compounds have not been established.
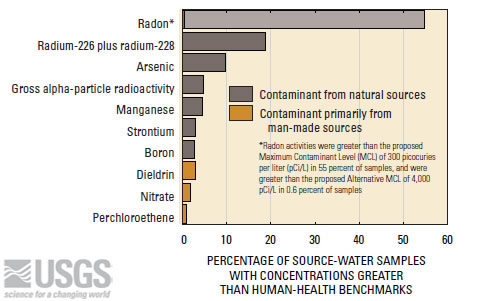
Figure 9.21: Ten contaminants, including seven from natural sources and three from primarily man-made sources, each were detected at concentrations greater than human-health benchmarks in at least 1 percent of source-water samples from public wells. Radium, arsenic, gross alpha-particle radioactivity, nitrate, and perchloroethene are regulated in drinking water under the Safe Drinking Water Act.
Image from URL: http://water.usgs.gov/nawqa/studies/public_wells/top_ten.html
Snow
For over 40 years, scientists working for the Internal Panel on Climate Change (IPCC) have been trying to understand how our climate is changing on a global scale. One of the tools they use is a suite of computer models, designed to simulate how the earth’s systems may change as our climate changes. Most of these models suggest that if carbon dioxide levels continue to rise at their current rate, global temperature will also continue to increase and will be correlated with changes in snow and ice cover. Here is a map generated by one of the models, based on this “extreme” scenario (A1F1):
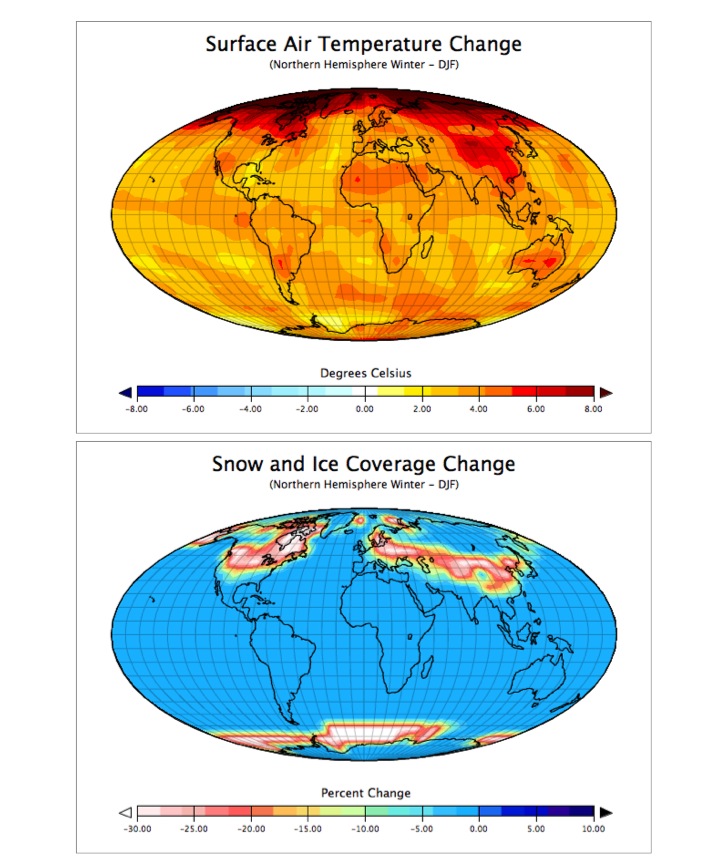
Figure 9.22: Maps of the changes in a) temperature and b) snow and ice coverage predicted for the year 2100 using the EdGCM software running the most extreme IPCC scenario, A1F1 from a “control simulation.” The “control simulation”, also run using the EdGCM, approximated the climate for the period 1951-1980 using 1958 greenhouse gas values.
Image from URL: http://serc.carleton.edu/eet/envisioningclimatechange/index.html
You can run this model yourself here.
Birds
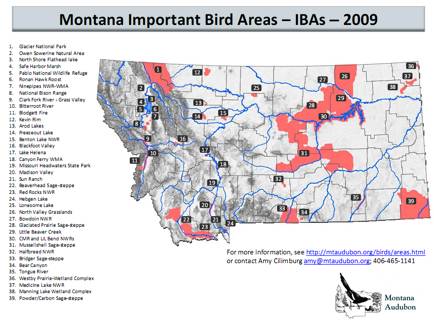
Montana Audubon, a non-profit group dedicated to the study of Montana’s bird life, has identified key bird habitats around the state as part of its’ Important Bird Areas (IBA) Program. The IBA Program is part of the National Audubon Society’s global mission to identify, monitor, and protect critical habitats for conserving healthy bird populations. There are 39 Important Bird Areas in Montana, five of which are designated for protection of Greater Sage-Grouse and sage-steppe associated bird species. Greater Sage-Grouse were recently determined to warrant protection under the Endangered Species Act, based on declines in population numbers (30% since 1985) due to human impacts such as invasive species, urbanization, energy development and overgrazing.
Plants
The Montana Natural Heritage Program (MNHP) “provides information on Montana’s species and habitats, emphasizing those of conservation concern.” The MNHP collects records on the distribution, abundance and ecology of plant and animal species (even insects!) from around the state, and provides this information to the public in a variety of formats – including maps.
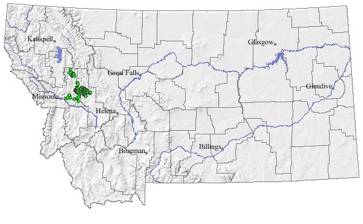
Figure 9.24: Here is an example of information from the MNHP Field Guide for Howell’s Gumweed (Grindelia howellii), a state species of concern due to its’ small population size and restricted range. Howell’s Gumweed typically lives in disturbed areas, where it must now compete with invasive plant species introduced by humans. At the same time, humans apply herbicides to kill invasive weeds, which can also kill Howell’s Gumweed.
Image from URL: http://fieldguide.mt.gov/detail_PDAST470E0.aspx
You can get involved in mapping native species here.
Bugs
As you already discussed in the module, aquatic macroinvertebrates can be good indicators of the biological health of waters. Here is an example of how one watershed group in Washington, D.C. created a map of macroinvertebrate data to show trends in stream health in their watershed:
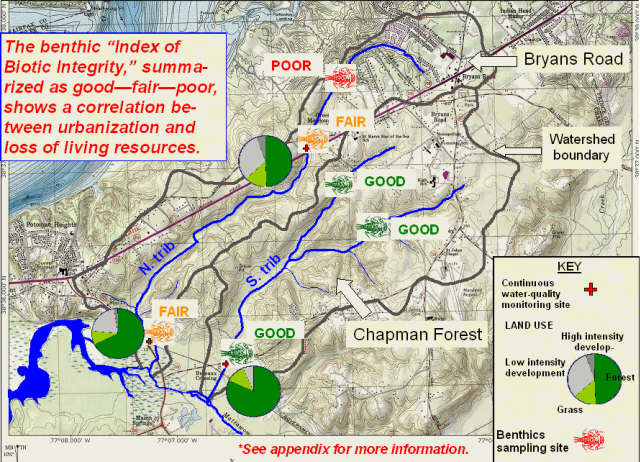
Figure 9.25: Benthic macroinvertebrate communities indicate aquatic quality. Benthic macroinvertebrates are easily visible bottom-dwelling animals such as insect larvae. They form an important element of the aquatic food chain. The species composition indicates aquatic quality. The mayfly-larva icons show sites sampled by volunteers with DNR’s Stream Waders program.
Image from URL: http://mattawomanwatershedsociety.org/tale5.aspx
