Schoolyard Mapping Activity
In order to use a field site at or near your school as a “natural laboratory”, a good starting point is to create your own sketch map of the area. This will help you:
- Observe natural and human features at a field study site;
- Represent features graphically;
- Explore how the field site changes over time.
Your map will serve as backdrop for activities you will learn in other modules. We will also learn to use Google Earth to view publicly available maps of a field site area and compare them to the sketch map you produced.
Required Materials
- Field notebook (or sheets of drawing paper)
- Pencils
- Crayons, colored pencils, markers, etc.
- Ruler
- Measuring tape
- Compass
Maps are created for many reasons, so it is important to depict those features that are most relevant to your study. Start by asking yourself: Why am I making this map? Who is this map for? What is this map going to be used for? In our case, we are creating a map of a field site that will serve as a resource in future science studies of our “natural laboratory”. In other modules, we will be investigating living (biotic), nonliving (abiotic), natural and anthropogenic features at a site.
To create our maps we must do the following:
- Observe the important features at our site. Think about which ones should be represented on our map and why – what relationships do we want to illustrate?
- Create symbols to represent the features we want to characterize.
- Measure the boundaries of our site and distances between features. Use those measurements to draw our site to scale. This means that any distance on our map reflects a specific distance on the ground.
- Select a reference frame for our map. We will use a compass to create our reference frame.
Directions
- Divide up mapping tasks among group members. You will need:
- Map designer (1 person) – draw features, scale, etc. on the map
- Table recorder (1 person) – fill in table of environmental features
- Field observers (2 – 3 people) – locate and observe features, measure distances
- As a group, walk the field site and identify important features of a “natural laboratory”:
- biotic – trees, bushes, insects, birds, wildlife, fish, people, etc.
- abiotic – buildings, walkways, fences, tables, statues, shadows, sun, snow, etc.
- potential safety risks – broken glass, sharp wire, etc. Discuss how to avoid risks.
- As a group, decide on symbols you will use to represent the different features. At the bottom of your map, create a legend that explains what each symbol represents.
- Use a compass to draw a reference frame (N, S, E and W) at the bottom of the map.
- Using a meter tape and/or by pacing, estimate the length and width of the site. Depending on the size of the area, determine an appropriate scale for your map. Use a ruler to help draw the scale in metric units.
- Draw the important features to scale on your map. Describe aspects of the important features in your table that are not conveyed by the map alone.
- Go inside and compare the maps and tables produced by different groups. Discuss:
- Which features appeared on most maps?
- Which features differed among maps?
- Why are certain types of plants and wildlife found at this site while others are not? Can you relate the patterns to anthropogenic impacts?
- How does the presence or absence of living organisms relate to abiotic or biotic features listed on the maps and tables?
- Would your map or table look different if you created it during a different season?
- Would you consider any of the plants or wildlife you found “not welcome”?
- Does the map you created meet your original stated purpose?
Download the Field Site Table for this activity by clicking here.
How to Use a Compass to Create a Reference Frame
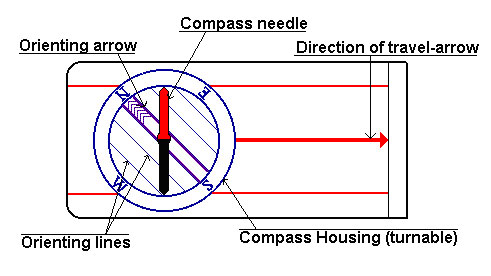
Your compass will look something like this.
Look at the compass needle. If you move around it likely will too. That is because the red part of the compass needle always points towards the earth’s magnetic north pole. To create a reference frame for your map, hold the compass flat on top of your map and turn the compass housing until the north orienting arrow lines up with the red needle (see Figure 1.17 below).
Draw the directions as you see them on the compass face as your reference frame at the bottom of your map. For more on basic use of a compass with maps, check out: http://www.thecompassstore.com/howtousemapa.html.
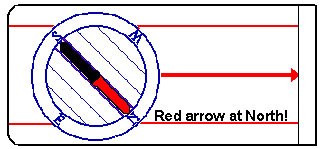
Figure 1.17: A typical compass aligned to create a reference frame.
Image from URL: http://www.learn-orienteering.org/old/lesson1.html
How to Read a Meter Tape
Meter tapes typically read in meters with either centimeter or millimeter increments between the meters.
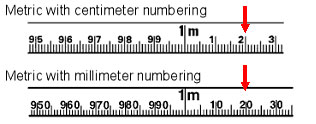
Figure 1.18: A typical meter tape.
Image from URL: http://www.usatf.org/events/courses/certification/manual/
For example, the red arrows in Figure 1.18 read at 1 meter 2 centimeters (top) or 1 meter 20 millimeters (bottom). You would write either as 1.2 m on a map.
Examples of Schoolyard Field Maps
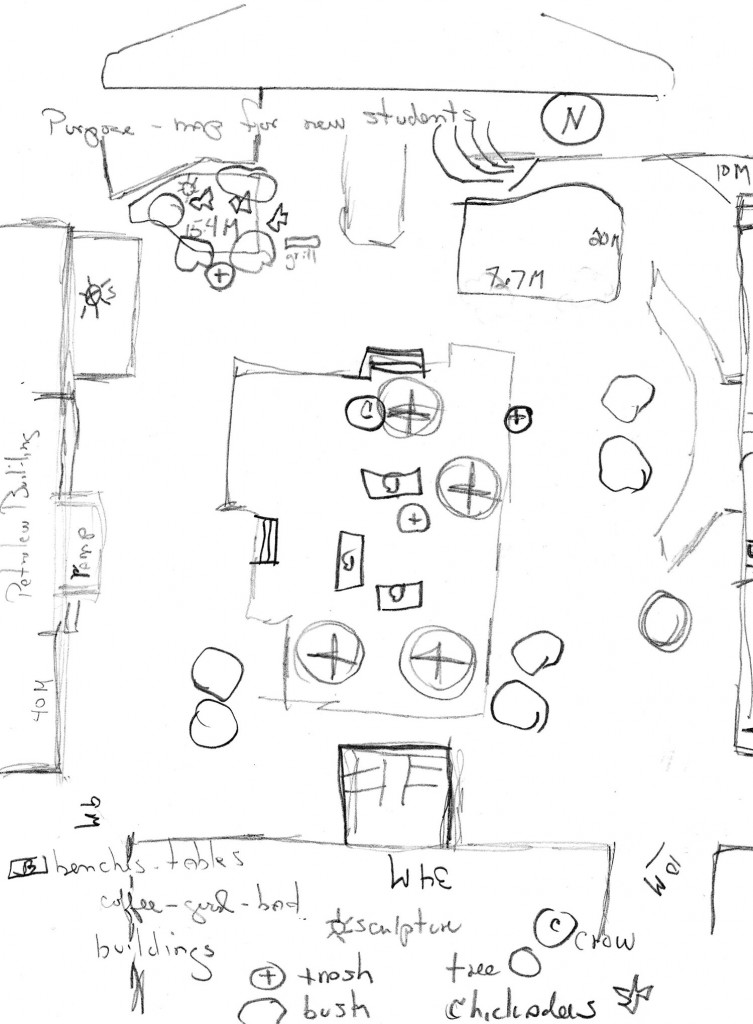
The maps below in Figures 1.19 and 1.20 can serve as examples to keep in mind while creating your own schoolyard map.
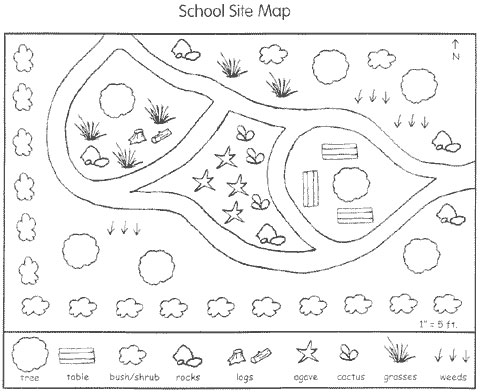
Figure 1.19: An example of a basic schoolyard field map.
Image from URL: http://www.dfg.ca.gov/education/newsletter/2003/mapactivity.html
