Water Quality Parameters: Dissolved Oxygen

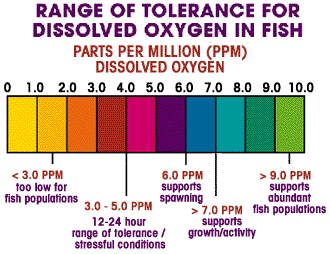
Figure 4.10: Typical dissolved oxygen ranges for fish populations.
Image from URL: http://islandwood.org/kids/stream_health/Data/DOchart.gif
Dissolved oxygen, often referred to as DO, is simply the amount of oxygen that is dissolved in the water. It is measured in mg/L or ppm and is correlated with the water’s temperature to give a % saturation.
When DO levels fall below 8 or 9, most trout and oxygen-sensitive aquatic insect populations like stoneflies become highly stressed. Dissolved oxygen levels less than 6 mg/L will not support trout or many other species of good aquatic life.
Factors that commonly affect dissolved oxygen concentrations are seasonal and daily temperature fluctuations, photosynthesis/decomposition of aquatic plants and water velocity/depth.
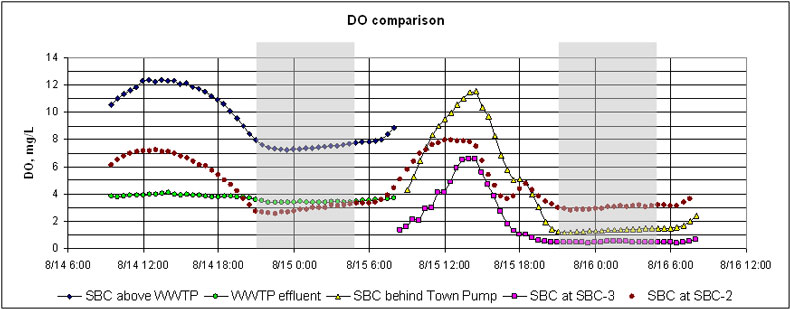
The daily fluctuations of dissolved oxygen are in response to the daily fluctuations of other parameters, namely temperature but also pH. This point is raised to illustrate that field data from water quality monitoring is only a snapshot in time (i.e. it only represents the quality or condition of the water at the time it was sampled). That is why water quality monitoring must be performed on a consistent basis throughout the year (for example, quarterly or seasonally) in order to draw more accurate conclusions about the health of our water resources.
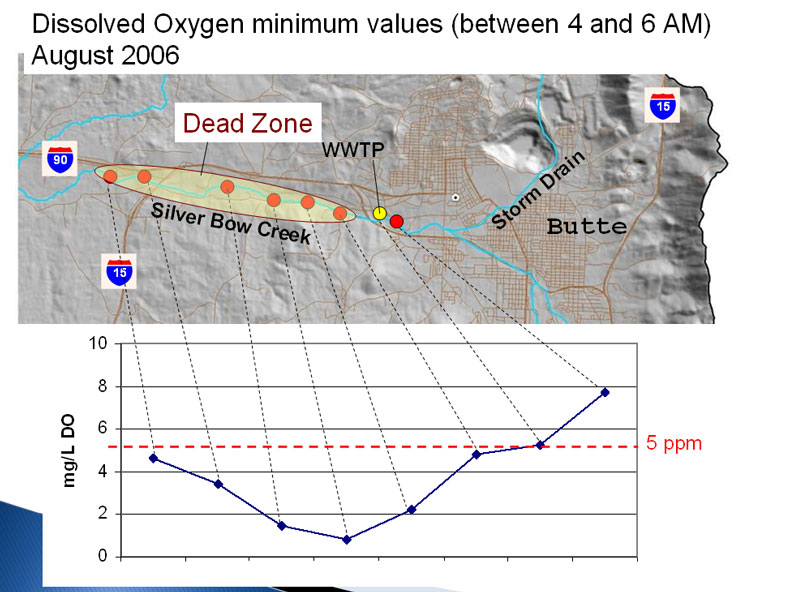
Below is a graphic from the 2006 research of Montana Tech’s Dr. Chris Gammons and Beverly Plumb on Silver Bow Creek near Butte, Montana showing the stream’s 24-hour (diurnal) fluctuations in dissolved oxygen concentration. Notice that if dissolved oxygen were only measured once during the afternoon, one would not likely draw the conclusion that there is not enough oxygen in Silver Bow Creek to support trout. Lesson learned: the more often water quality parameters are monitored, the more you can conclude from the data.

