Earth’s Energy Budget

Figure 5.9: The water cycle is one example of how energy flow relates to Earth system cycles.
Image from URL: http://ga.water.usgs.gov/edu/watercycle.html
The balance within the Earth’s systems is largely dependent on a steady flow of energy into and out of each of these systems. Earth’s systems constantly move energy around in cycles (e.g., water cycle, rock cycle, life cycles).
The balance of this movement of energy within the Earth’s systems is crucial in maintaining life and in regulating the climate of the Earth. This balance of energy is sometimes called cryosphere.
Check Your Thinking: What do we mean by the Earth’s energy budget?
Where does the energy that enters the Earth’s atmosphere come from?
There is also energy within Earth’s systems that flows back out into space. Where does that energy come from?
When solar radiation enters Earth’s systems, it gets converted to other forms of energy, mainly heat (infrared radiation). Where is that heat stored in the Earth’s systems?

Figure 5.10: The Earth can be considered as a physical system with an energy budget that includes all gains of incoming energy and all losses of outgoing energy. The planet is approximately in equilibrium, so the sum of the gains is approximately equal to the sum of the losses. Note on this image: The graphic depicts only net energy transfer. There is no attempt to depict the role of greenhouse gases and the exchange that occurs between the Earth’s surface and the atmosphere or any other exchanges.
Image from URL: http://en.wikipedia.org/wiki/File:57911main_Earth_Energy_Budget.jpg

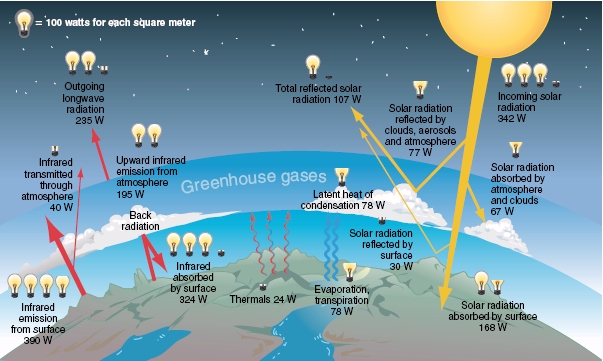
Figure 5.11: The illustration above shows the Earth’s annual average energy budget. Make two columns and label them “Net gain” and “Net loss”. What is the value of these two columns? Are they equal?
Image from URL: http://cimss.ssec.wisc.edu/sage/meteorology/lesson1/activity1.html
For an interactive exercise in identifying energy transfer for some phase changes of water in the Hydrologic cycle, visit Meteorology » Earth’s Atmosphere, Energy Budget and Energy Cycle from the Satellite Applications for Geoscience Education website. Click on “3. Earth’s Energy Cycle” and follow the instructions to complete the exercise.
As you will see in the next two sections, snow helps regulate the Earth’s energy budget.
Optional: For a more detailed explanation of Earth’s energy budget, refer to the NASA Earth Observatory web page on Climate & Earth’s Energy Budget.