How Are Maps Used in Science?
It is possible to discover relationships between different phenomena by analyzing map information. The process of creating a map is a form of scientific examination. The art of making maps is called cartography. While professional map-makers are called cartographers, many other types of scientists make and use maps. Let’s look at a few examples of different maps created by scientists and explore what the maps are used for.
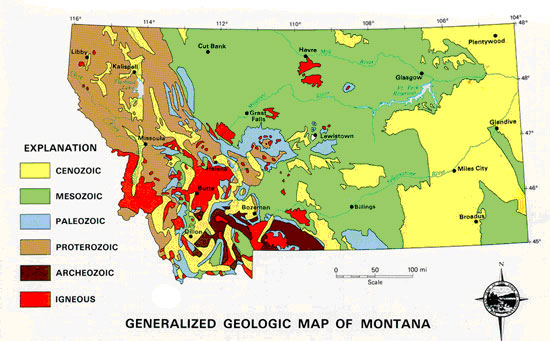
Figure 1.7: A geologic map is used by geologists to document geologic features below the earth’s surface. This map, produced by scientists at the Montana Bureau of Mines and Geology, shows the age or origin of major geologic deposits around Montana.
Image from the Montana Bureau of Mines & Geology.
Check Your Thinking: Can you identify the grid system used to create this geologic map?
- Latitude & Longitude
- UTM
- State Plane
- Public Land
![]()
Click on the checkmark to view the correct answer.
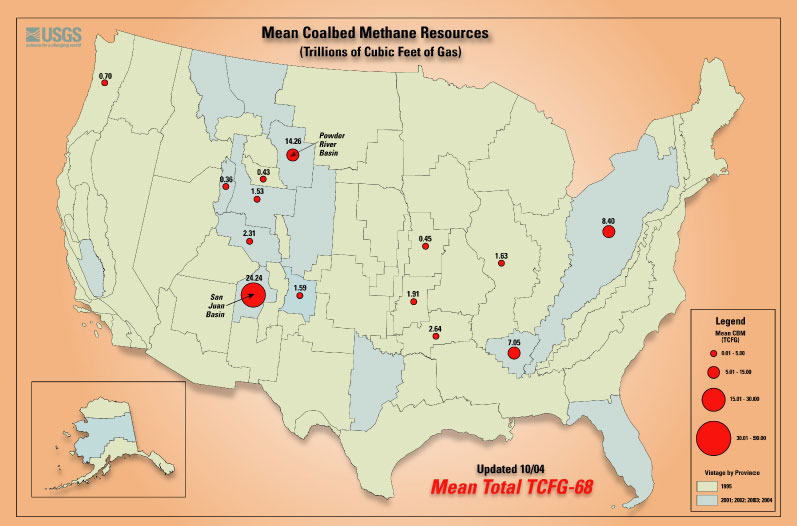
Figure 1.8: Mining, geological and environmental engineers frequently use geologic maps when working on energy development issues. This geologic map shows the distribution of major coal bed methane deposits in the United States. Engineers design plans for pumping methane out of coal beds and capturing it for use as a natural gas fuel source.
Image from URL: http://serc.carleton.edu/images/research_education/cretaceous/cbm_map.jpg
The Crow Reservation, which borders the Powder River Basin in southwestern Montana, has considerable methane resources that they are considering developing in the coming years. This will require a substantial amount of coordination among scientists from the federal government, the State of Montana and the Apsáalooke (the name the Crow use to refer to their tribe) Nation – and the use of many maps!
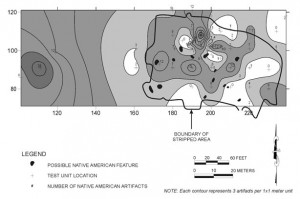
Figure 1.9: This is a map of a dig site in Augustine Creek, Delaware. It is crucial to accurately document the number and location of Native American artifacts when they are found at a site like this. If this turned out to be a grave site, the artifacts would likely be reclaimed or reburied by a local tribal authority under the auspices of the Native American Graves Protection and Repatriation Act.
Image from URL: http://www.deldot.gov/archaeology/augustine_creek/chapter_5.shtml
An anthropologist studying evidence left behind by past peoples would use an archeological map to document a dig site. Typically a scientist working a dig site would meticulously map the site using transects, carefully digging through the earth along the transect lines to uncover artifacts.
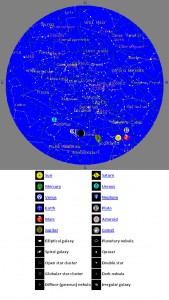
Figure 1.10: This is a map of the night sky visible from Helena, MT on December 30, 2008. If you viewed the night sky above Helena using a telescope, you would see many of the constellations and planets indicated on this sky map.
Image from URL: http://www.fourmilab.ch/cgi-bin/Yoursky
An astronomy map would be used by those studying celestial features of the universe. Large model sky maps are used as educational tools at planetariums.
A scientist studying climate or weather would use a meteorological map to illustrate atmospheric patterns.
If you look at the legend on this weather map, it shows different colors in units of dBZ. The colors represent different values of energy that are reflected by precipitation back towards a Doppler radar instrument. Called echoes, the reflected energy intensities are measured in dBZ (decibels of z). The scale of dBZ values is related to the intensity of precipitation. Typically, light precipitation is occurring when the dBZ value reaches 20. The higher the dBZ, the greater the rate of precipitation.
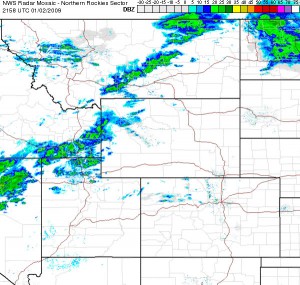
Figure 1.11: This is an image of precipitation in the Northern Rockies on January 2, 2009, based on radar data from the National Weather Service. Montana is the state covering the upper portion of the map.
Image from URL: http://radar.weather.gov/Conus/northrockies.php
A soil scientist would be interested in an agricultural map like the one below.
Can one map show everything? How frequently do you need to create maps? Maps are usually static snapshots, so it’s hard to illustrate landscape features that change rapidly or intensely. Yet natural and anthropogenic features of an ecosystem can change over days, weeks, seasons and years. Thus some maps need to be created in rapid time series, such as the daily updates of forest service fire maps. The drought monitor maps we just examined are published once a week. This helps farmers, ranchers, weather and climate scientists, and land and water resource managers make plans to manage the impacts of a drought.
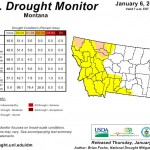
Figure 1.12: This map shows drought intensity and incorporates data such as soil moisture, temperature, and streamflows.
Check Your Thinking: This map reflects drought conditions as of January 8, 2009. It also includes information in a table about drought conditions 1 year ago. How would this map have looked different on January 8, 2008?
![]()
Click on the checkmark to view the correct answer.
A forestry map would be used by scientists interested in presenting data on the distribution and abundance of trees.
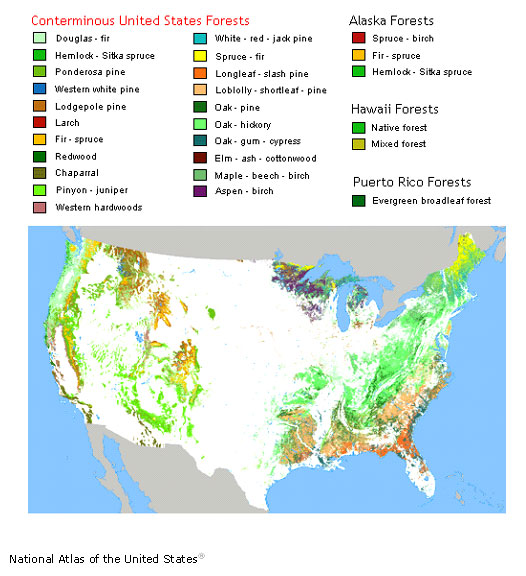
Figure 1.13: This map shows forest cover types, and was created by US Forest Service scientists. Click on the link below to view the map in its original context, where you can view different types of forest cover on the map by moving your cursor over the categories in the legend at the top of the image.
Image from URL: http://www.nationalatlas.gov/articles/biology/a_forest.html
This map is based on remote sensing data collected using satellite imagery and GPS data collected during the 1991 growing season. The data was analyzed on a computer using a geographic information system (GIS). The GIS program used the satellite and GPS data to assign the trees in different forest stands to particular cover types such as douglas-fir, oak-hickory, etc.
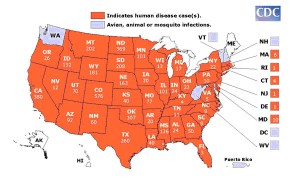
Image from URL: http://www.cdc.gov/ncidod/dvbid/westnile/mapsactivity/surv&control07Maps_PrinterFriendly.htm
A scientist studying human or animal health might want to make an epidemiology map like this one.
Check Your Thinking: Why would an epidemiologist make this map?
![]()
Click on the checkmark to view the correct answer.
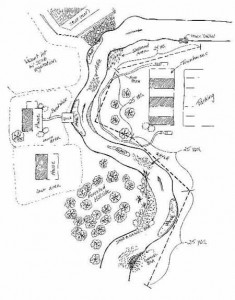
Figure 1.15: This is an example of a field sketch map of a stream site created by an Environmental Protection Agency scientist.
Image from URL: http://www.epa.gov/volunteer/stream/vms41.html
We just looked at ways many kinds of scientists can use different types of maps in their research. Most of the maps we explored involved the collection of a lot of data over a fairly large area. How could you create a less data-intensive map to study local environmental problems in your community and schoolyard?
Scientists working to document the condition of small study areas typically use a sketch map as tool for studying their field sites. Sketch maps typically show major landscape features (buildings, trees, water, roads, etc.) with an emphasis on conditions the scientist is interested in. For example, the archeological map we already looked at was based on a field sketch map. It emphasized the location and number of Native American artifacts found at the field site. A forest scientist making a field sketch map of a forest stand would likely add notes on the height, spacing and condition of trees. An environmental engineer planning a stream restoration project would note the condition of the stream bed, bank, and trees, and the presence of negative impacts such as mine tailings or streamside development.